
Part 2
This is the second in a series of essays exploring a chain of questions about complexity, life, consciousness, intelligence, and ethics. Together, they form a rough map of the journey, hopefully with not too many imaginary dragons along the way.
In the last essay, we argued that complexity is fundamental, and that it compounds naturally. Simple systems combine into more complicated structures, and those structures interact with other structures. Some arrangements vanish almost immediately. Others persist, because the properties of their parts make some patterns more likely than others. Ordered complexity does not require intention. It can arise naturally because atoms have specific properties, molecules take specific shapes, and local environments constrain what can happen.
If ordered complexity can arise naturally, then life may perhaps be understood as a later threshold in the same story. Even when the necessary conditions are there, the transition to life may be difficult and possibly quite rare. But still, it is a threshold inside nature, grounded in physics and chemistry.
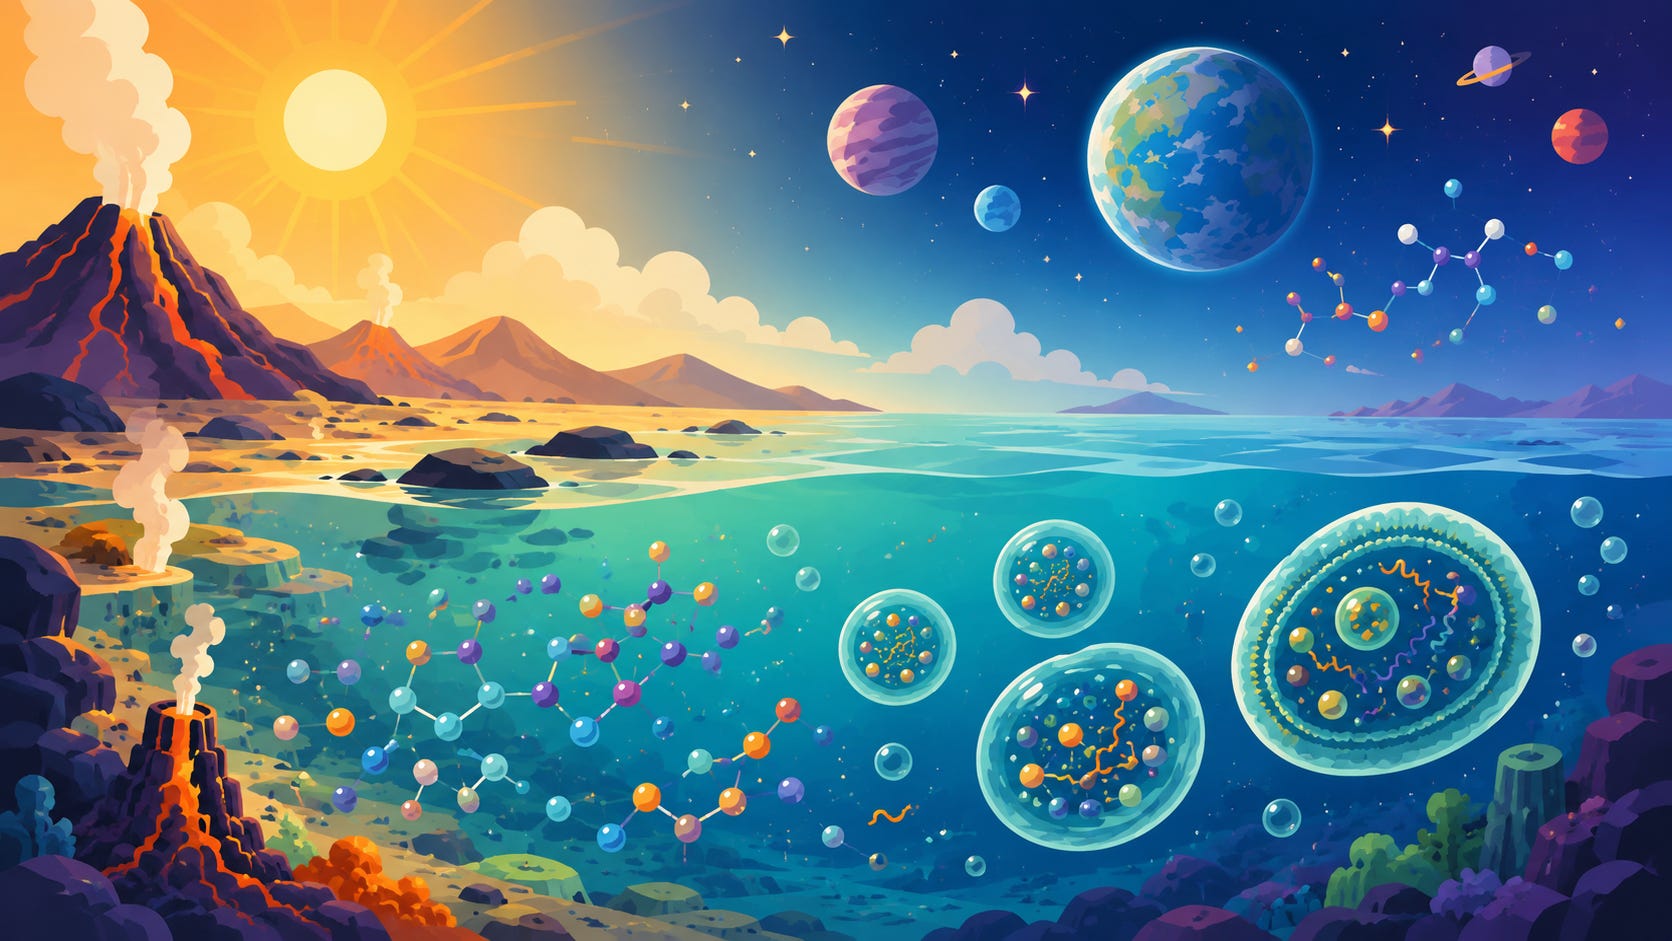
Nature has had billions of years to explore these possibilities, but we have not yet demonstrated in controlled laboratory conditions exactly how non-living chemistry can give rise to life. What experiments have shown is that many of the ingredients associated with life can arise through natural processes. Amino acids and organic molecules, as well as sugars, fatty acids, nucleobases, and other useful building blocks, can appear under plausible conditions. We also know that some of these materials have also been found in meteorites and interstellar environments, so we know that the raw materials of life are not something completely exotic.
The laws of physics and chemistry, as far as we can tell, apply throughout the universe. Reactions between chemical elements, when subjected to similar conditions, follow the same set of rules everywhere we can test. Stars forge heavier elements inside their cores and stellar winds and supernovae distribute them in the surrounding space. Planets, moons, comets, asteroids, ice, dust, form during the same star-formation processes and provide the many environments in which chemistry can unfold.
Every living system must process energy in some form, because maintaining order requires work. Stars hosting planetary systems provide these planets with usable energy for billions of years. But direct sunlight is not the only possible source of energy that life can tap. Hydrothermal vents, tidal heating, radioactive decay, and chemical gradients may also provide usable energy in the right environments.
So if life requires ordered chemistry, usable energy, and suitable environments, then it would be reasonable to assume that the Earth is probably not unique in satisfying the basic conditions. The pertinent question is then how often do those ingredients arrange themselves into systems that preserve and reproduce their own organization? Carbon and water seem to be extremely important here.
Life, at least on Earth, and possibly elsewhere, is built on complicated carbon scaffolding and uses water as its solvent. That does not prove that all life everywhere must do the same, but it gives us a sober starting point, because carbon is extremely flexible chemically. It forms strong bonds with many atoms, including with itself, and can form long chains, rings, branches, and very large molecules that are stable enough to persist while remaining active enough to participate in complex chemistry. Carbon is so fundamentally important to life as we know it that it even has its own branch of chemistry, organic chemistry.
Silicon is sometimes proposed as an alternative because it sits below carbon in the periodic table and shares some bonding behaviour. The problem is that silicon is not nearly as chemically flexible as carbon. In the presence of oxygen, it tends to form silicon dioxide, which is extremely stable, and can form various minerals and quartz, which is great if one wants nice rocks, but it is far less promising if one wants flexible molecular machinery. But there will be more to say about silicon later. For now, the important things to take away here, are that there is far more Carbon than Silicon in the Universe and that, when it comes to forming complex scaffolding structures, Carbon beats every other element, including Silicon, hands down.
Biologists also insist on the role of liquid water, as a powerful solvent, which allows molecules to dissolve, move, meet, react, separate, fold, and recombine. Water can remain liquid across a specific range of conditions and one of its very useful properties is that it expands when it freezes. This means that when an ice layer forms, it can insulate and preserve liquid water below it.
There may be other solvents that can perform similar roles. Methane is discussed in relation to very cold worlds such as Titan, but colder chemistry tends to be slower, and we have not yet found any life that does not rely on carbon and water. So, for now, carbon and water are the best game in town. They are simply extremely good at the job.
Still, a chemical soup of complex structures, however promising, remains a soup until some deeper organization arises. The crucial shift comes when chemistry begins to preserve structure through time. A living system carries something forward: it maintains a boundary, stores information, regulates internal processes and uses energy to repair and rebuild. Its variations become exposed to selection, with earlier arrangements influencing later arrangements. Some patterns make successor patterns more likely, and some variants persist better than others under local conditions. The system becomes a lineage.
Schrödinger’s old question, “What is life?” helped move the discussion away from vague appeals to a mysterious life force and toward physics, chemistry, order, and information.
Once stored information enters the loop, chemistry can preserve instructions that influence future structure.
Whatever awkward boundary cases exist, the cell, at least here on Earth, is the first clear unit where all the relevant processes come together. It has a boundary and can process energy. It stores information and uses it to build and repair itself. It maintains internal conditions and can respond to its environment. And it can reproduce, belonging to a lineage shaped by variation and selection. The cell is a tiny chemical reactor with “memory”.
Once reproduction, variation, and inheritance exist, evolution enters the story. Evolution explores what is possible under local conditions. Sometimes lineages gradually drift and sometimes they remain stable for very long periods. Life evolves somewhere, under particular conditions, with particular materials and pressures. The laws of biology are constrained by the local environment.
Changes in the local conditions, or available materials, affect the possible forms that life can take. Life adapts to environments, but over time it can also alter them. Oxygen in the Earth’s atmosphere is largely a biological product, and its soil is full of life. Coral reefs are byproducts of life, and living forests shape local climates. Ecosystems become networks through which energy, matter, and information move. In that sense, life does not simply evolve within an environment, but it can become part of the environment’s machinery.
Now, we have to remember that we have only one clear example of life: that which exists on the Earth. And all known life on Earth appears to share a common origin; all Earth life belongs to one vast biological family tree. But we cannot infer from a single example how common life may be in the Universe, or what forms it may take.
It could be that life appears readily wherever conditions are suitable, and it may very well be the case that simple microbial life is abundantly scattered throughout the universe. Or it could be that the transition from chemistry to life is an extremely rare event. This may be especially true when discussing complex life. Long-lived complex organisms may require a chain of favourable conditions: the right kind of star, a stable orbit, liquid water, a suitable atmosphere, enough heavy elements, geological recycling, climate stability, shielding from destructive radiation, protection from excessive impacts, plate tectonics, a planetary magnetic field, and vast stretches of time without experiencing any catastrophic events. Conditions allow possibilities, they don’t guarantee outcomes. Habitable does not imply inhabited.
So there are at least a couple of questions we need to unpack here; How common is the transition from complex chemical structures to simple life? And once simple life is established and given enough time, how common is highly complex life?
It may turn out that microbial life may be very common in the universe, while complex animal life may be rarer. Or simple life may be uncommon, and technological intelligence extremely rare. But such deliberations belong to a later part of our journey.
We are well on the way to at least getting some real answers on the first question. The search for life elsewhere will probably begin indirectly. Of course we should not expect to see forests, animals, or cities on distant planets. This is impossible with current technology. If the first evidence comes from another world, it will likely be chemical: promising traces in an atmosphere, unusual combinations of gases, or signs that a planet is chemically out of balance in ways that are difficult to explain without life.
Detecting one type of biosignature molecule by itself will not prove much. Methane, for example, can have geological sources, and Oxygen can arise without any biology under some conditions. We will need patterns of evidence: multiple signals that fit together, a planetary environment where the interpretation makes sense, and alternative explanations ruled out as far as possible. The first convincing evidence could also come from closer to home, from Mars, Europa, Enceladus, Titan, or some other Solar System environment where chemistry has had time and shelter to become interesting.
So, where does all this leave us? A useful working definition might be this: Life is a self-maintaining form of organized complexity, sustained by energy flow, that stores heritable information and belongs to a lineage capable of adaptive evolution through variation, inheritance, and differential persistence.
This is a rough definition, but it maintains that life marks a real threshold. Before life, patterns may persist, but it is only with life that patterns begin to maintain themselves through time. Life interacts with its environment, responding to local conditions, moving toward some chemical gradients and away from others. It starts behaving as though some states are preferable to others, and optimizing for its own existence. Is that some kind of primitive awareness?
At what point can we start speaking about experience, and when does a complex living organism become a sentient life form?
Further reading
Erwin Schrödinger’s “What Is Life?” for the classic question of how living order can be understood through physics, chemistry, and information; Jim Baggott’s “Origins” for a modern scientific account of the path from the Big Bang to life and consciousness; Lisa Kaltenegger’s “Alien Earths” for habitable worlds, biosignatures, and the search for life beyond Earth.
Related lighter and fun fiction
Olaf Stapledon’s Last and First Men imagines the long evolution of life, humanity, and successor species across deep time; Isaac Asimov’s fiction repeatedly explores life, intelligence, robotics, and civilization through clean thought experiments; Ursula K. Le Guin’s novels are excellent companions for thinking about life, culture, difference, ecology, and moral imagination.


